The Reports & Analytics module in Orangescrum Cloud offers a wide range of project and team performance insights through visual reports and detailed data breakdowns.
It empowers teams, managers, and executives to monitor progress, identify bottlenecks, and make informed decisions for continuous improvement.
Track what’s working, fix what’s not, and plan your next move smarter.
Types of Reports
Orangescrum divides reports into three major categories:
- Task Analysis Reports – Understand task trends, resolution time, and workflow performance.
- Time & Resource Reports – Evaluate how your team spends time and resources.
- Agile & Others Reports – (For Scrum boards, backlog velocity, and sprint analytics).
Task Analysis Reports
1. Average Age Report
Purpose: Displays the average number of days open tasks have been active in each project.
Why it matters: Helps you track backlog health and identify long-pending work.
How to use:
- Select a Project Name.
- Choose Period (Daily, Weekly, Monthly).
- Set the Days Previously range (e.g., last 7 or 30 days).
- Click Submit to generate the report.
Insights Provided:
- Average task age in days
- Total unresolved (new & in-progress) tasks
- Task aging trend line
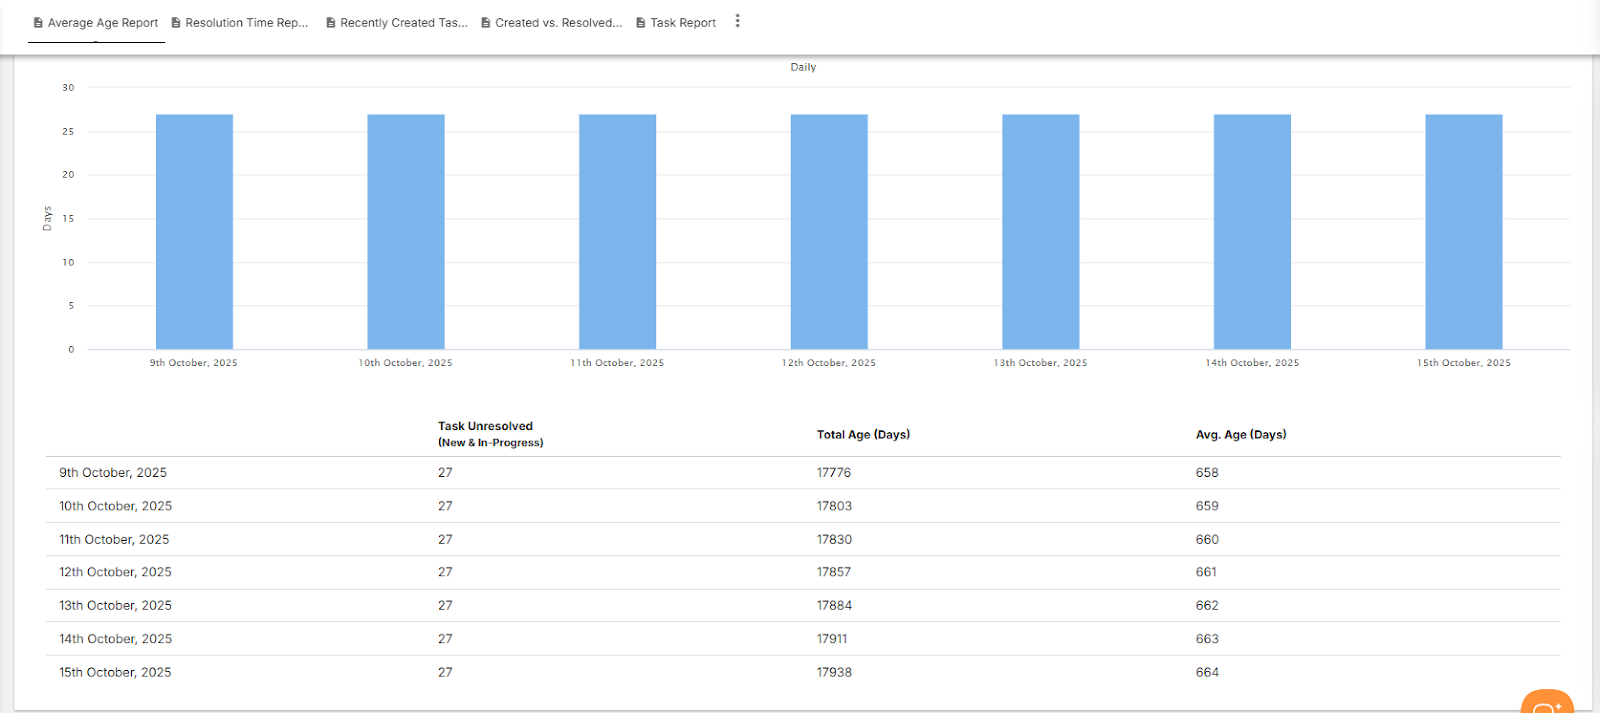
Use this to ensure older tasks don’t clog your backlog.
2. Resolution Time Report
Purpose: Tracks how long tasks take to be resolved from creation to closure.
Why it matters: Measures team efficiency and adherence to delivery timelines.
How to use:
- Select a Project Name and Period (Daily, Weekly, Monthly).
- Choose how many Days previously you want to analyze.
- Click Submit to view resolution trends.
Insights Provided:
- Total resolution time (in days)
- Average resolution time per task
- Planned vs. actual closure comparison
A must-have metric for understanding delivery speed.
3. Recently Created Tasks Report
Purpose: Shows how many new tasks have been created within a selected date range.
Why it matters: Helps managers assess workload inflow and plan allocations.
How to use:
- Choose Project Name → Select Period (Daily/Weekly) → Define Days Previously → Click Submit.
Insights Provided:
- Count of unresolved (new & in-progress) vs. resolved & closed tasks
- Trendline showing task creation frequency
Ideal for sprint planning and monitoring task inflow rates.
4. Created vs. Resolved Tasks Report
Purpose: Compares how many tasks were created versus resolved over a specific period.
Why it matters: Indicates whether your team is keeping up with its workload.
How to use:
- Select Project Name, Period, and Days Previously.
- Toggle Cumulative Totals to view aggregated trends.
Insights Provided:
- Daily or cumulative count of created and resolved tasks
- Backlog growth or reduction trends
Balance your team’s output with incoming work for better backlog control.
5. Bug Report
Purpose: Tracks bug discovery, closure, and severity trends across projects.
Why it matters: Provides QA and product managers visibility into product quality and issue resolution rate.
How to use:
- Select Start Date and End Date.
- Click Submit to view charts and trends.
Insights Provided:
- Bug Trend Chart (Opened vs. Closed)
- Bug Status Chart (Open, In Progress, Fixed, Closed)
- Bug Severity Chart (Critical, Major, Minor, Trivial)
A complete quality snapshot for your software projects.
6. Time Since Task Report
Purpose: Tracks how long tasks have remained open, in progress, or completed.
Why it matters: Highlights slow-moving tasks or workflow bottlenecks.
How to use:
- Select a Project, Date Field (Created, Updated, or Closed), Period, and Days Previously.
- Click Submit to generate a time-based trend chart.
Insights Provided:
- Task count by creation/completion date
- Duration analysis of work in progress
- Cumulative trends for comparison
Great for understanding your project’s task turnaround time.
Time & Resource Reports
Accessible from the Time & Resource Reports section in the Reports module.
1. Hour Spent Report
Purpose: Shows a burn-down chart of total time and effort spent by resources on different tasks and task types.
Why it matters: Enables managers to visualize productivity and track effort across teams.
Insights Provided:
- Time spent by each user or team
- Breakdown by task type (Bugs, Features, Improvements)
- Cumulative time spent vs. tasks closed
Quickly see if effort aligns with project goals.
2. Timesheet Report
Purpose: Consolidates all logged working hours by user, project, and task.
Why it matters: Essential for payroll, billing, and performance tracking.
Insights Provided:
- Estimated vs. Logged hours
- Billable vs. Non-Billable time
- Submitted, Approved, and Rejected timesheets
Ideal for tracking productivity and financial compliance.
3. Profitability Report
Purpose: Provides a summary of budgets, costs, and income for all active projects.
Why it matters: Helps management evaluate financial health and profitability at a glance.
Insights Provided:
- Budget allocation and utilization
- Cost of resources vs. earned revenue
- Profit margin trends
Measure your project ROI with precision.
Agile & Scrum Reports
For teams using Orangescrum’s Agile Boards, this section displays sprint performance metrics such as:
- Sprint Velocity
- Burndown Charts
- Story Points Completed
- Workload by Sprint
Enable continuous improvement in Agile workflows.
Exporting Reports
All reports in Orangescrum can be exported for review, presentations, or audits.
Steps:
- Open any report view.
- Apply filters (Date, Project, Resource, etc.).
- Click Export → CSV or PDF.
Exports retain chart data and column structures for easy offline analysis.
Filters & Customization
Each report allows you to fine-tune data using:
| Filter | Description |
| Project Name | Choose specific projects to analyze. |
| Date Range | Set start and end dates for custom periods. |
| Period | Daily, Weekly, Monthly summary views. |
| Cumulative Totals | Show aggregated or daily data points. |
| Days Previously | Define retrospective analysis duration (e.g., last 7 days). |
Flexible filters let you drill down into exactly what you need.
Best Practices
- Schedule weekly report reviews with your team.
- Use “Created vs. Resolved” to balance incoming and outgoing workloads.
- Review “Bug Reports” before every release cycle.
- Monitor “Resolution Time” to maintain healthy SLAs.
- Track “Profitability” monthly for accurate financial reporting.