Plan, allocate, and track your team’s time efficiently.
The Resource Management module in Orangescrum Cloud provides a complete view of how your team’s time is planned, used, and optimized across projects.
It allows project managers to track utilization, allocation, and team performance in real time—ensuring that resources are neither underused nor overloaded.
From estimated hours to actual time spent, Orangescrum gives you the visibility you need to manage people effectively.
Why Use Resource Management
- Balance Workload: Avoid burnout by tracking utilization across tasks and projects.
- Optimize Productivity: Compare estimated vs. logged hours to identify inefficiencies.
- Enhance Profitability: Distinguish between billable and non-billable work.
- Data-Driven Decisions: Generate utilization and allocation reports for better forecasting.
- Improve Accountability: Every resource log is time-stamped and project-linked.
Accessing Resource Management
To access the Resource Management module:
- Go to the Left Navigation Menu.
- Click Resource Mgmt → Resource Utilization.
- Select your preferred date range at the top-right corner of the page.
- View utilization data across all team members and projects.
By default, the dashboard shows utilization within the current week. You can adjust the timeline for broader insights.
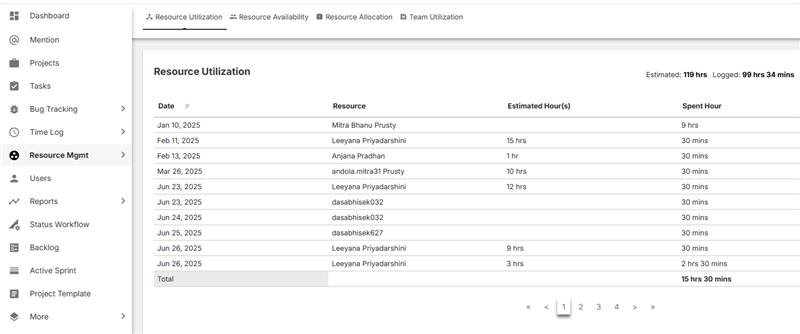
Understanding the Resource Utilization Report
The Resource Utilization Report provides detailed visibility into how much time each team member spends versus what was estimated.
| Column | Description |
| Date | Displays the date when the effort was logged or estimated. |
| Resource | Name of the team member working on tasks or projects. |
| Estimated Hour(s) | The total planned or assigned hours for that day. |
| Spent Hour | Actual time logged through time tracking or timesheets. |
| Billable | Indicates whether the logged time is billable to the client (Yes/No). |
At the bottom of the report, Orangescrum also summarizes:
- Total Estimated Hours
- Total Logged Hours
- Total Billable and Non-Billable Hours
This comparison helps managers evaluate planning accuracy and utilization performance.
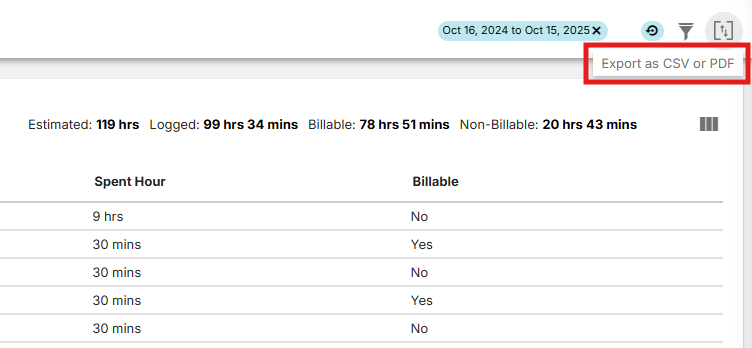
Top Summary Indicators
At the top-right of the dashboard, you’ll see quick metrics for the selected period:
- Estimated: Total planned hours across all users and projects.
- Logged: Actual hours recorded in timesheets.
- Billable: Total time that contributes to client billing.
- Non-Billable: Internal or overhead time not billable to clients.
Example from your view:
Estimated: 113 hrs | Logged: 156 hrs 51 mins | Billable: 60 hrs 53 mins | Non-Billable: 95 hrs 58 mins
If logged hours exceed estimated hours, it indicates potential overrun or overtime.
Pagination & Navigation
At the bottom of the page, use the pagination controls (< 1 2 3 4 5 >) to browse utilization data across multiple pages or dates.
This allows you to track historical utilization trends over extended periods.
Pagination helps in reviewing time data without overloading your screen.
Filtering Resource Utilization Data
You can refine your view using filters:
- By Date Range: Select specific start and end dates (e.g., last 2 weeks or last month).
- By Resource: Focus on one team member to view individual performance.
- By Project: Review utilization within a single client or project scope.
- By Billable Type: Toggle between Billable and Non-Billable hours for financial insights.
Use the filter icon at the top-right to customize your report.
Exporting the Report
You can export the Resource Utilization Report for offline use or client reporting:
- Click the Export as CSV or PDF option at the top-right corner.
- Choose the format you prefer.
- The exported report includes all columns — date, resource name, estimated, spent, and billable status.
Exported reports are ideal for billing, invoicing, and performance reviews.
How the Data Is Calculated
The data in Resource Utilization is automatically fetched from:
- Tasks (assigned estimated hours)
- Timesheets / Time Logs (actual hours spent)
- User Profile Settings (daily work capacity)
Orangescrum then compares Estimated vs. Logged Hours to display daily utilization.
Formula:
Utilization % = (Logged Hours ÷ Estimated Hours) × 100
This helps you understand whether your team is working below, at, or beyond their planned capacity.
Billable vs. Non-Billable Hours
| Type | Meaning |
| Billable Hours | Time that can be charged to a client for completed project work. |
| Non-Billable Hours | Internal activities such as meetings, training, or admin tasks. |
This distinction allows finance and project management teams to monitor profitability and efficiency accurately.
Aim to keep a healthy balance between billable and non-billable work.
Interpreting Utilization Data
Use the report to spot key performance indicators:
| Scenario | What It Means | Recommended Action |
| Logged hours > Estimated | Possible overtime or poor estimation accuracy. | Review task estimates and workload balance. |
| Logged hours < Estimated | Resource underutilized or incomplete work. | Reallocate tasks or adjust planning. |
| High Non-Billable Hours | Too much time spent on internal activities. | Review and limit unproductive work. |
| High Billable Hours | Efficient client time usage. | Monitor workload to prevent burnout. |
This data gives you both operational and financial visibility.
Team Utilization vs. Resource Allocation
The Resource Mgmt tab includes multiple related reports:
| Report | Description |
| Resource Utilization | Tracks actual vs. estimated time per resource. |
| Resource Availability | Shows how much free capacity each resource has. |
| Resource Allocation | Displays how resources are distributed across projects. |
| Team Utilization | Aggregated view of utilization across the entire team. |
All reports are interconnected — giving you a 360° view of team performance.
Best Practices
- Regularly review utilization reports to balance workloads.
- Track billable vs. non-billable hours for better profitability.
- Compare estimation accuracy over time for better forecasting.
- Use export reports for weekly management reviews.
- Train teams to log time daily to ensure real-time accuracy.
Consistent tracking builds transparency and predictability across projects.
Troubleshooting
If data appears incorrect or incomplete:
- Confirm time logs are submitted for all users and dates.
- Check if estimated hours are added to each task.
- Refresh the report after updating time entries.
- Ensure the correct date range is selected.
- Re-export the report if older data was recently updated.
Still seeing discrepancies? Contact Orangescrum Support for detailed analysis.
Summary
| Feature | Description |
| Resource Utilization Report | Tracks planned vs. actual hours daily. |
| Billable & Non-Billable Split | Distinguishes client-charged vs. internal hours. |
| Filters & Export | Customize and export reports easily. |
| Data Integration | Syncs automatically with time logs and tasks. |
| Team Visibility | Helps in balancing workload and improving efficiency. |
With Orangescrum’s Resource Management module, you can monitor time, optimize allocation, and make every project hour count.